
Screening Tool
The Screening Tool by FAST Graphs
Screening gives you the ability to quickly find new stocks. Different metrics, historical data, and estimate data can be easily added or removed at any time to customize the screen. Any screen you create and like can be saved so you can reuse it later.
Create a Screen
Click on "Screening" in the navigation panel, then click "My Screens" - "Create Screen"

Customize Screen
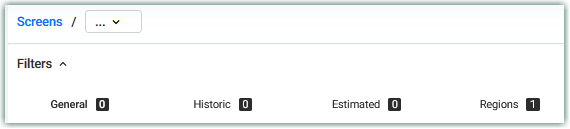
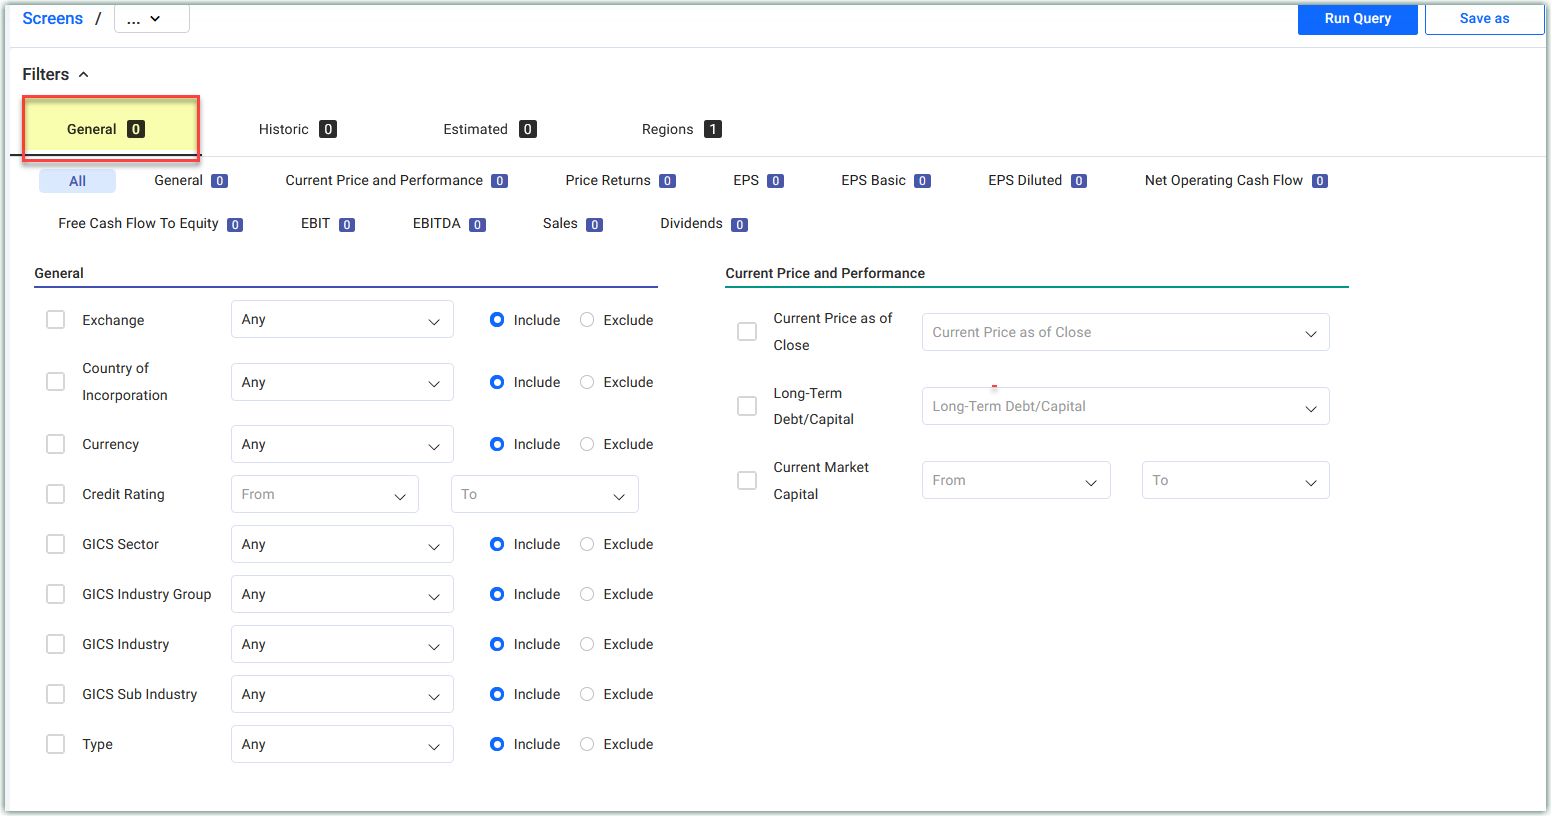
To customize the view, click on any of the four tabs at the top:
- General
- Historic
- Estimated
- Regions
General
Under the General section of the Screener, the general information about the company can be found. Items like Credit Rating, Sector and Sub-Industry, and Exchange can be found here. This information will be located in the FAST FACTS of the company.
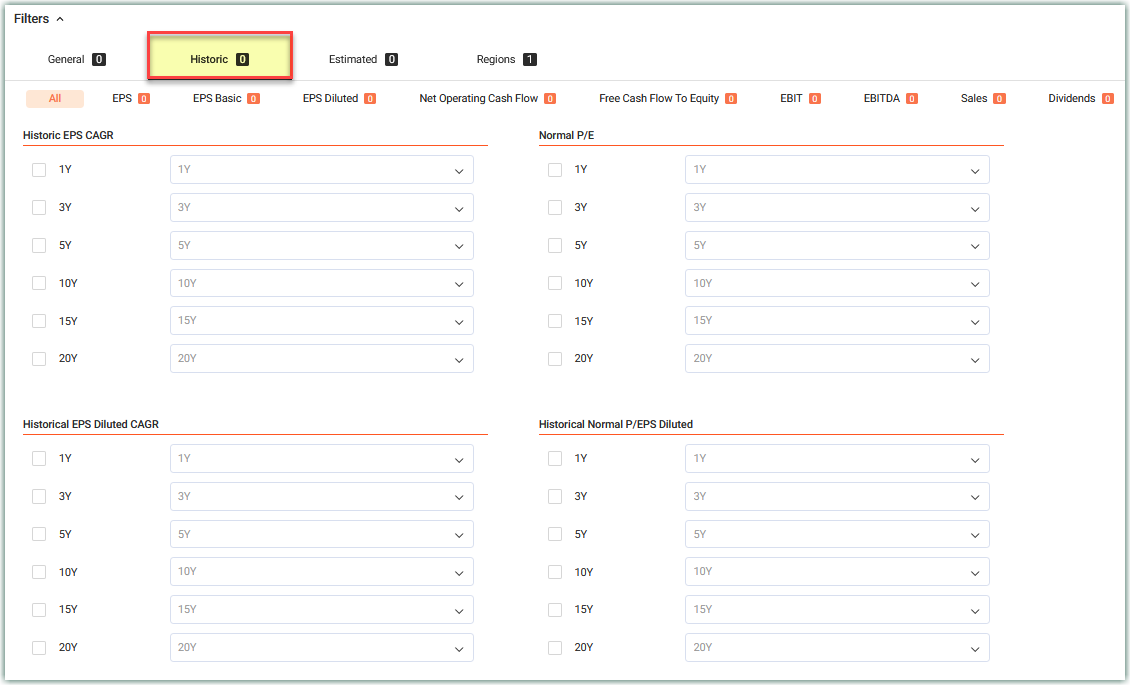
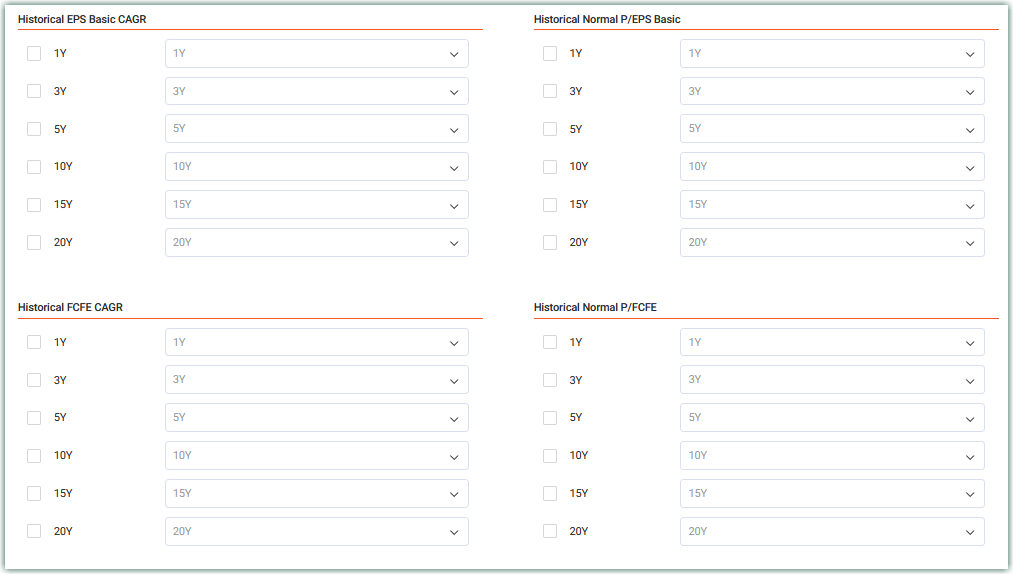
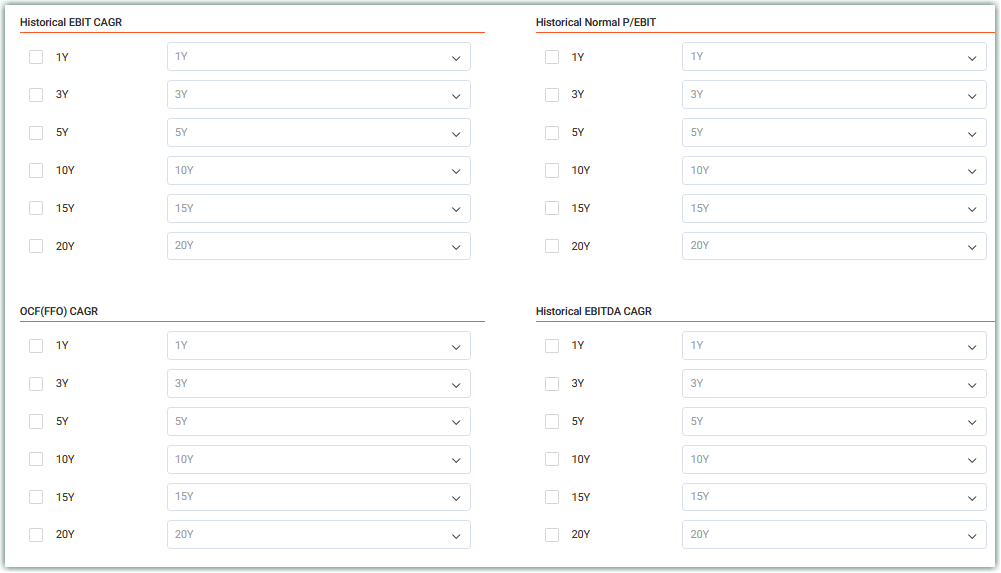
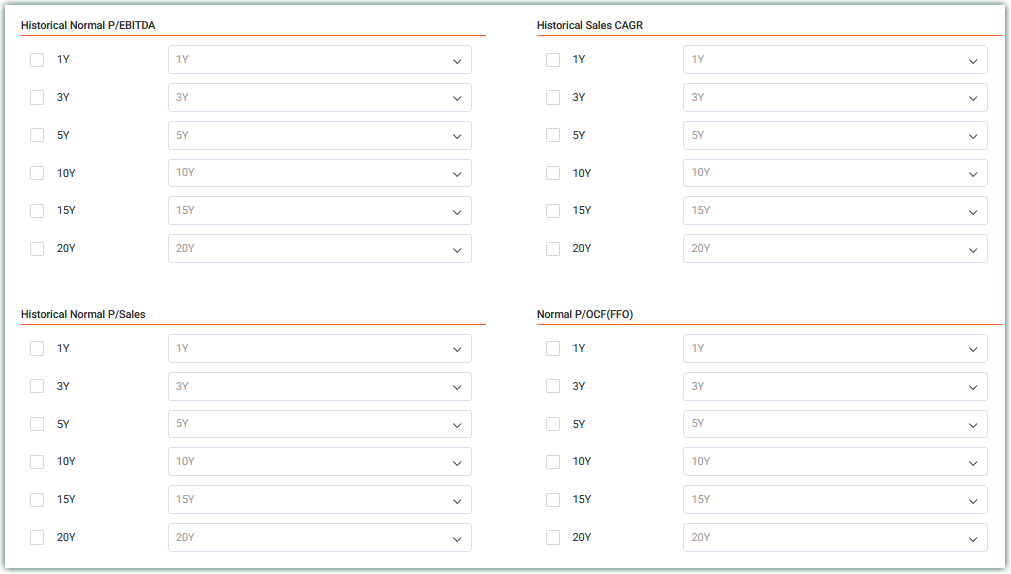
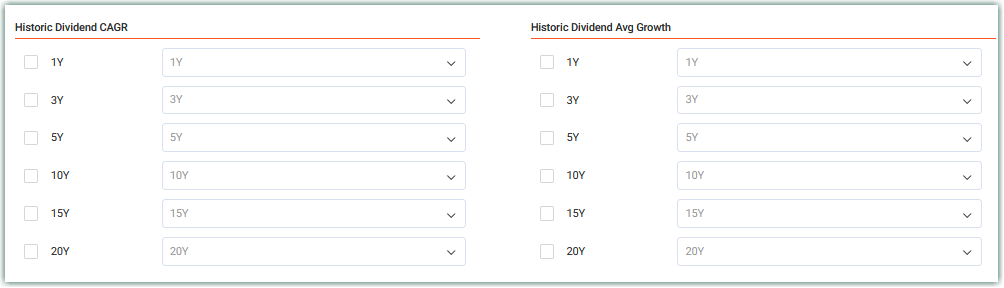
Historic
The Historic section gives the ability to analyze historical growth rates, historical Normal P/Es, and historical Dividend CAGRs just to name a few. These items can be found either in the FAST FACTS of each company, or in the Performance Chart.
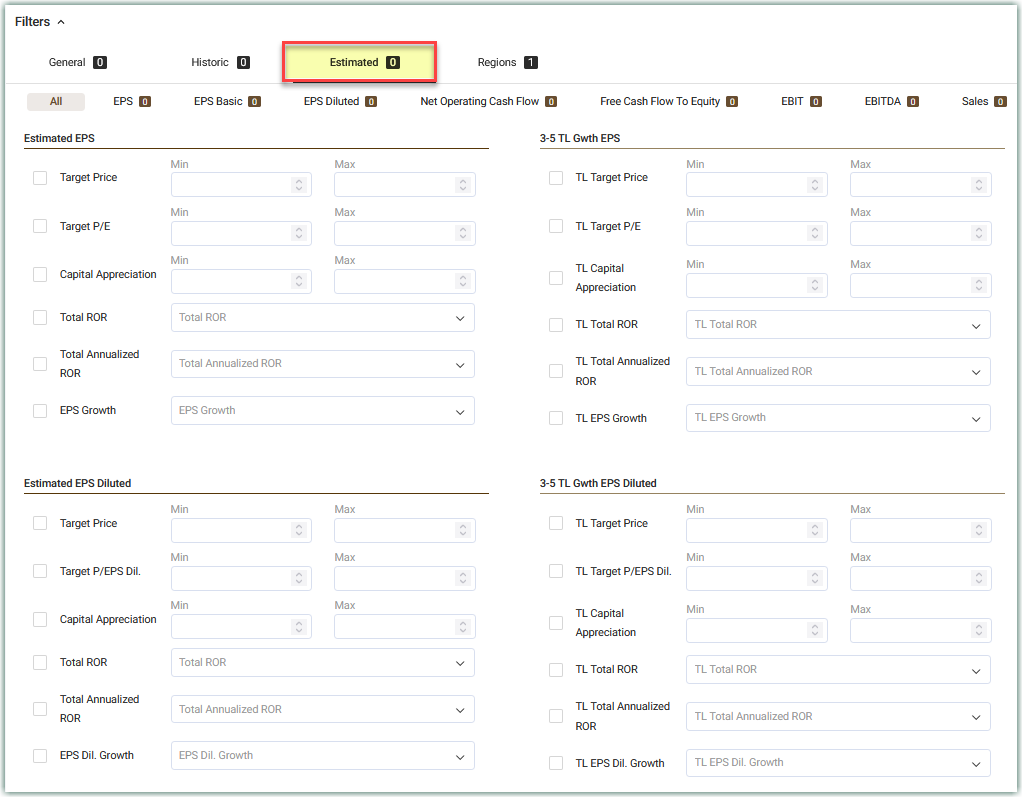
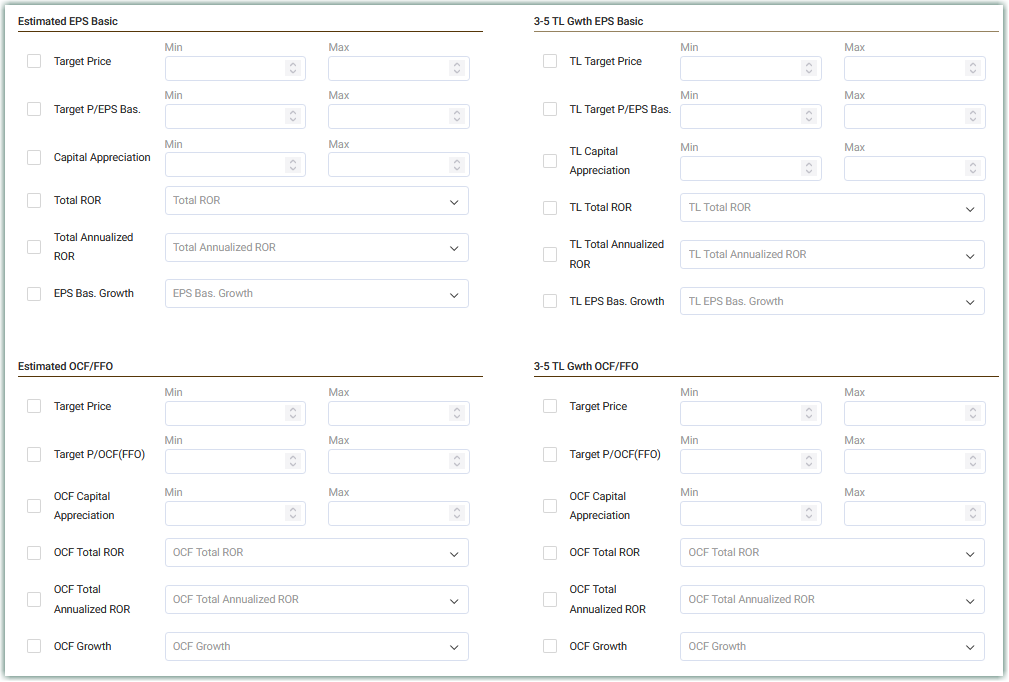
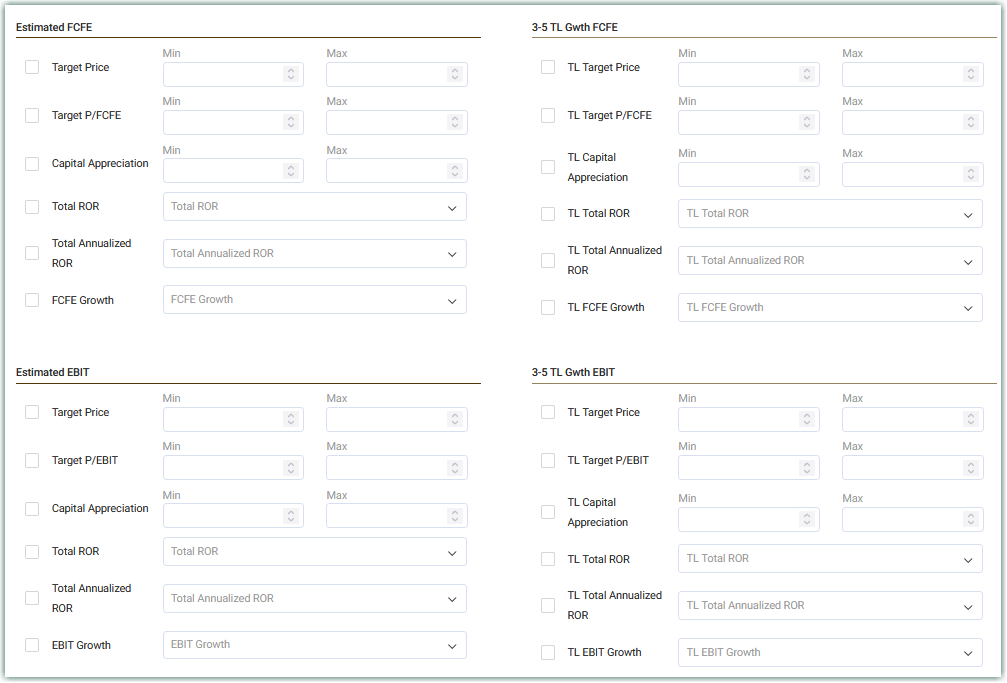
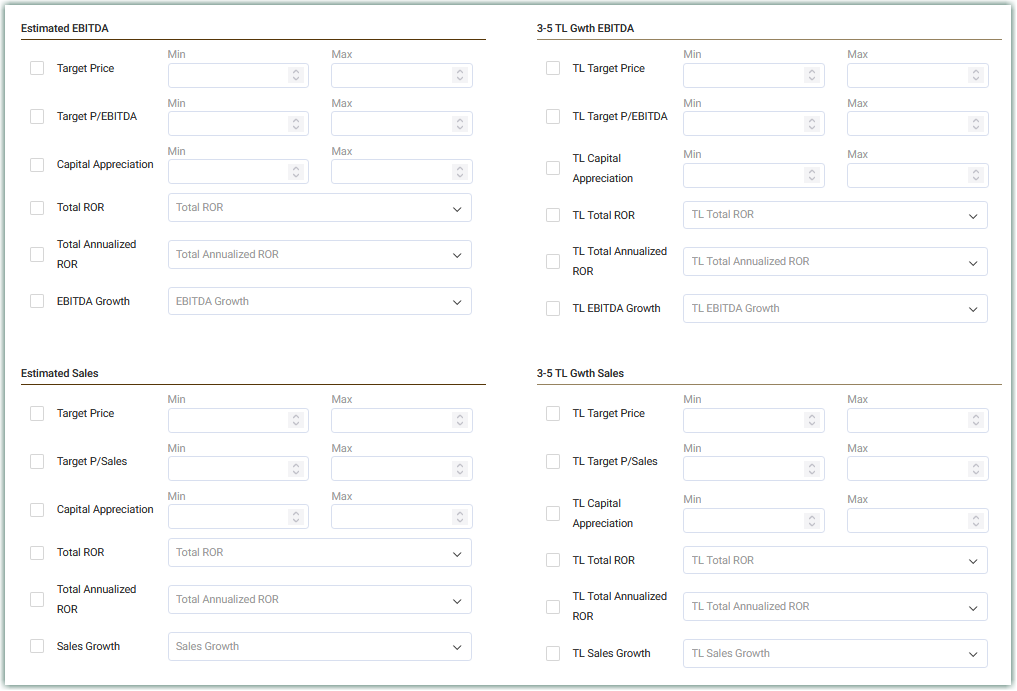
Estimated
The Estimated section displays data only found on the Forecasting Calculator: Estimates.
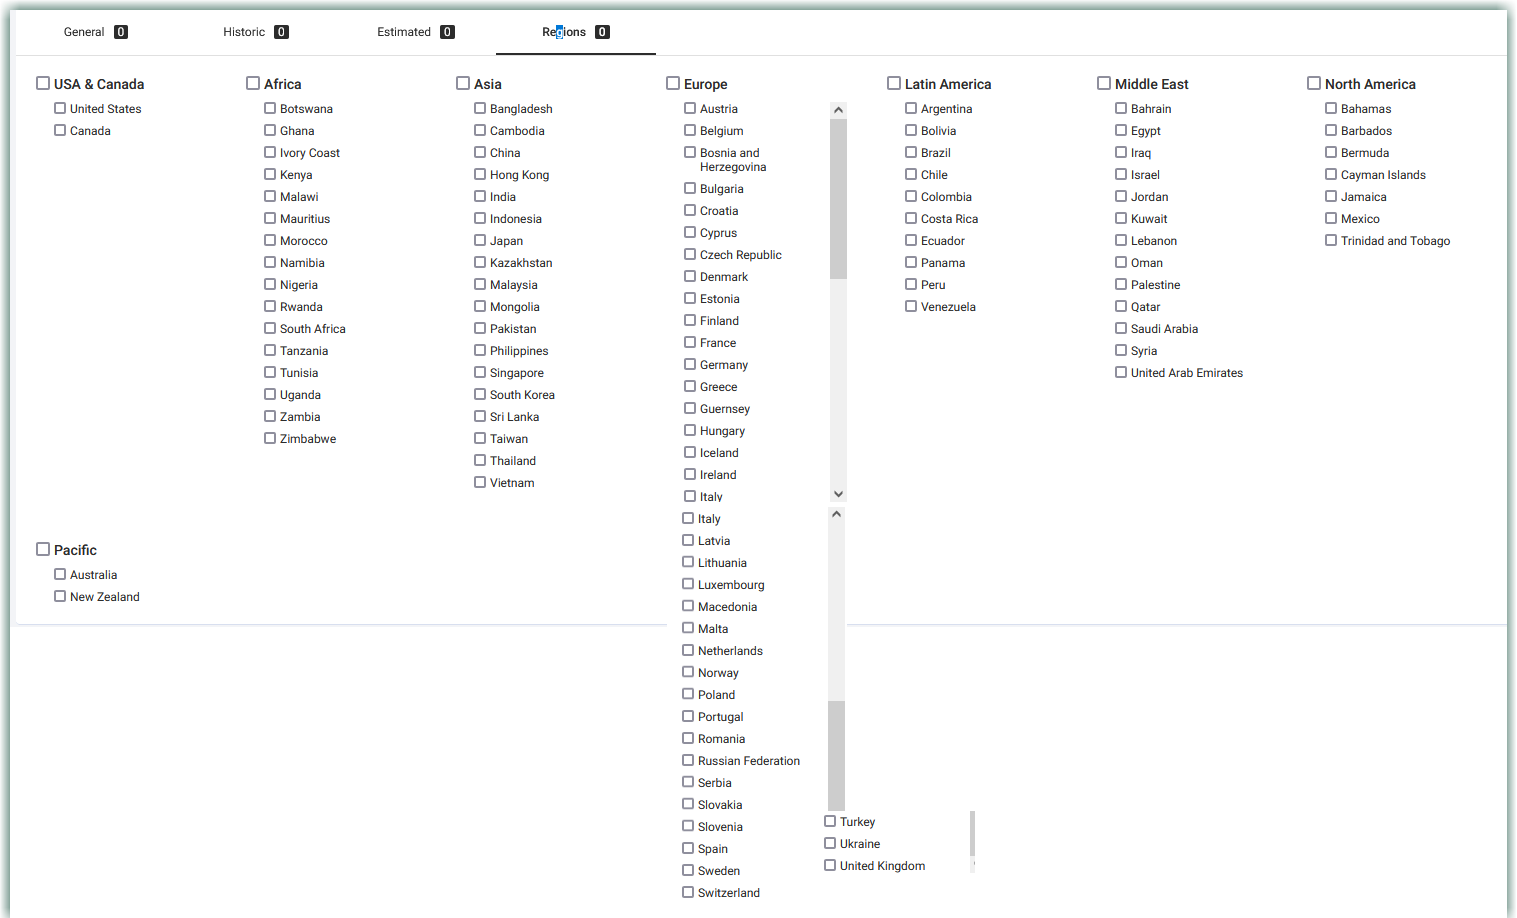
Regions
Once you have made your choices from the four tabs, click "Run Query"
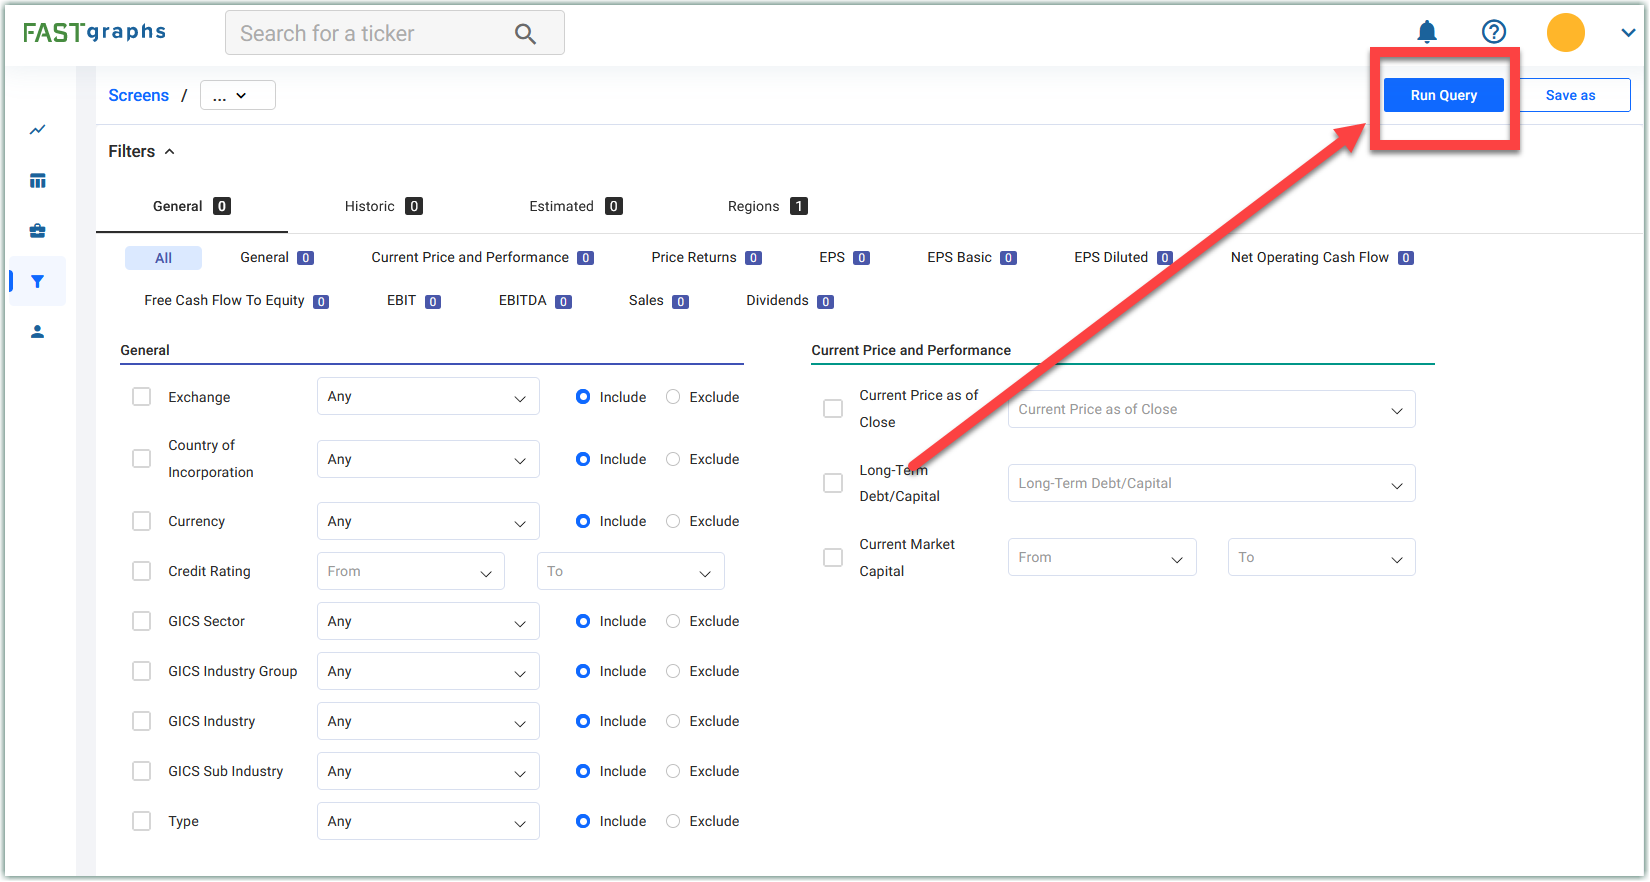
That will then bring up your Results
NOTE: If you have more than 500 results, you will need to narrow down your search by making additional choices and run additional queries.

You can save the screen by clicking the "Save As" button, and you can also create a portfolio by clicking the "Add to Portfolio" button.
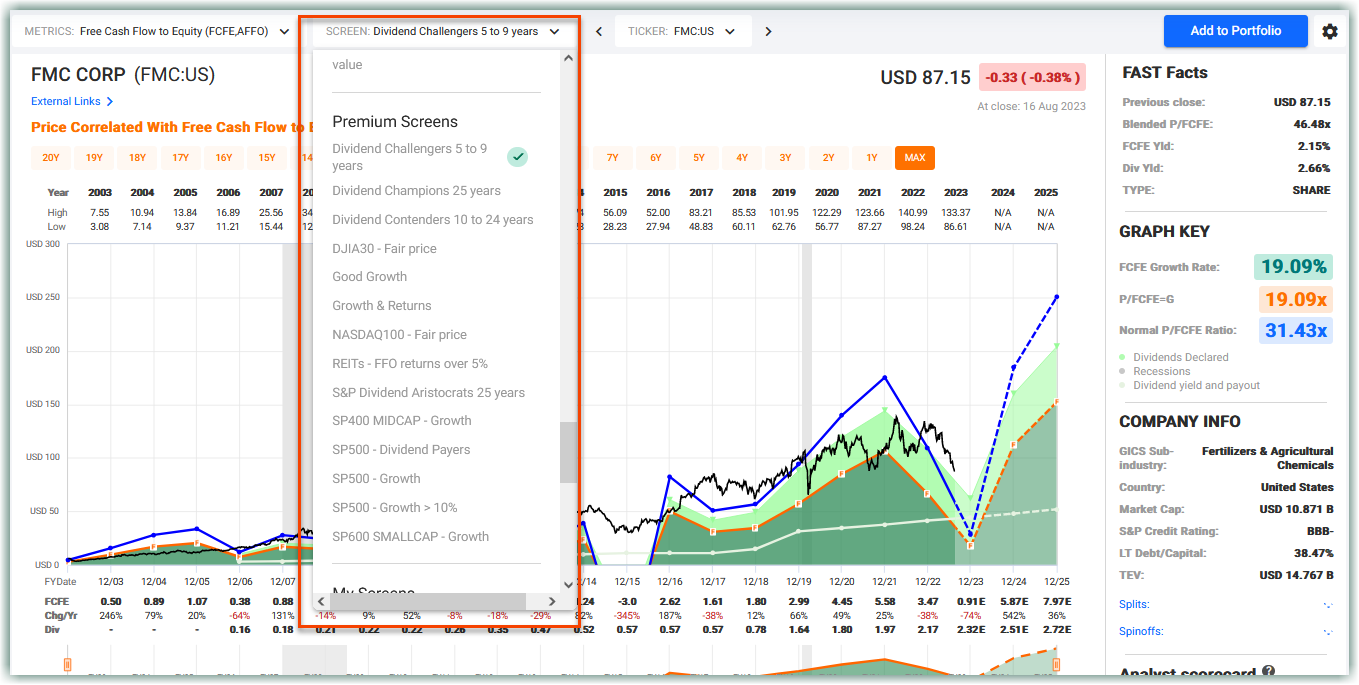
Pre-Set Screens
Premium users can now access a selection of preset screens! These carefully curated screens utilize key metrics and parameters to identify some of the best stocks available in the market. The lists are dynamic, updating daily based on the latest data published by companies. Find these lists under the "Preset Screens" menu within the Screening section of the app.
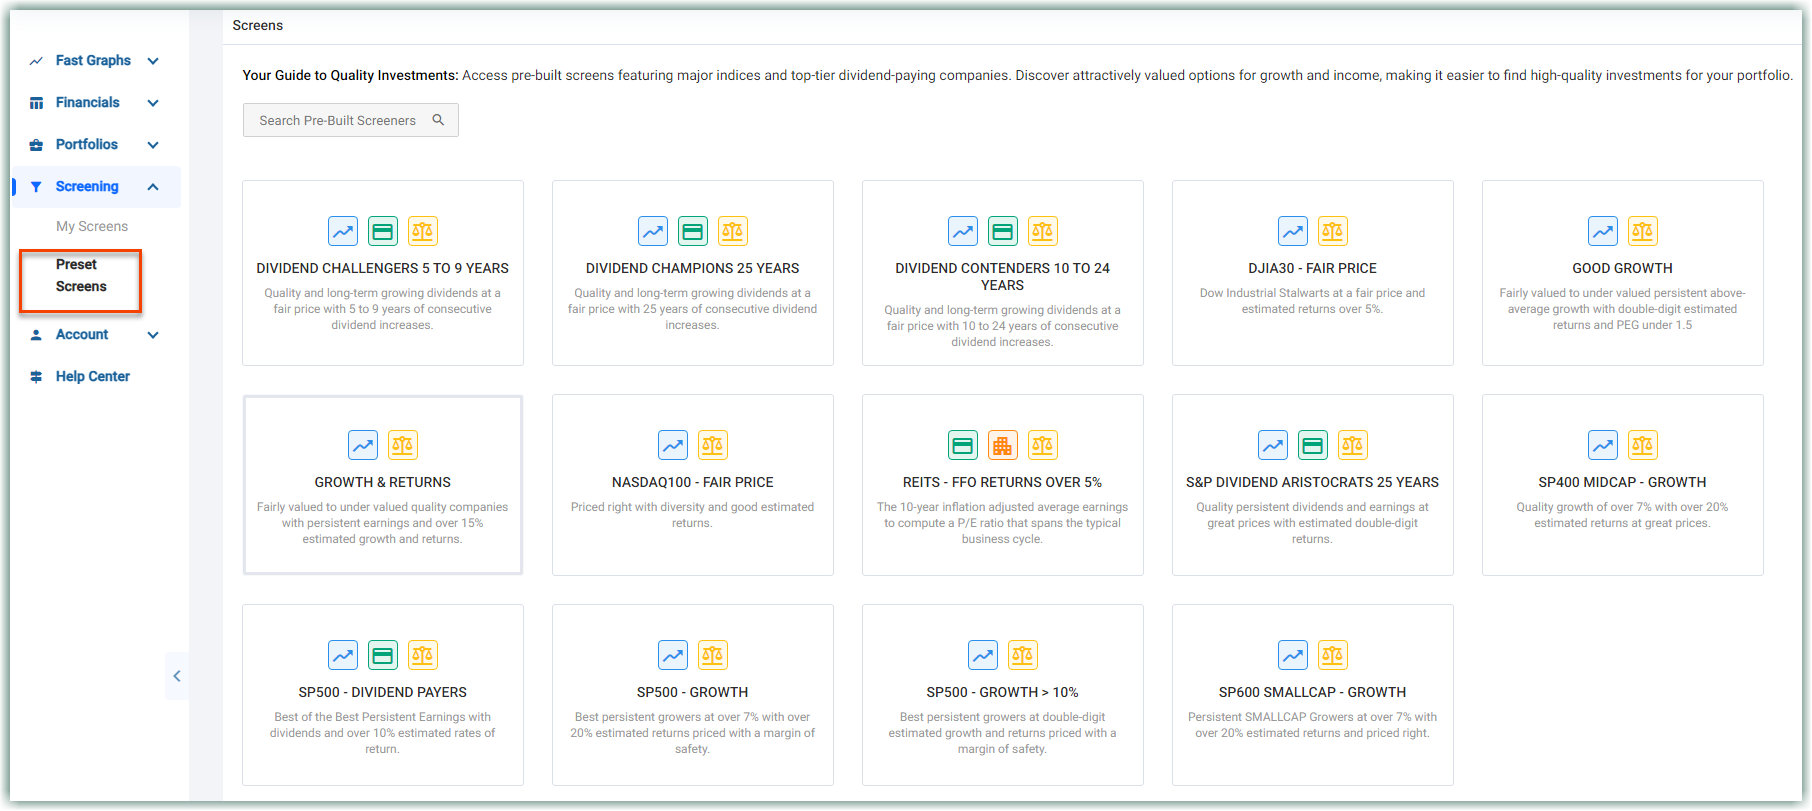
You can graph screens just like you do with portfolios. Click on a stock within the screen list or use the drop-down in the top menu bar in the FAST Graphs and Financials section.
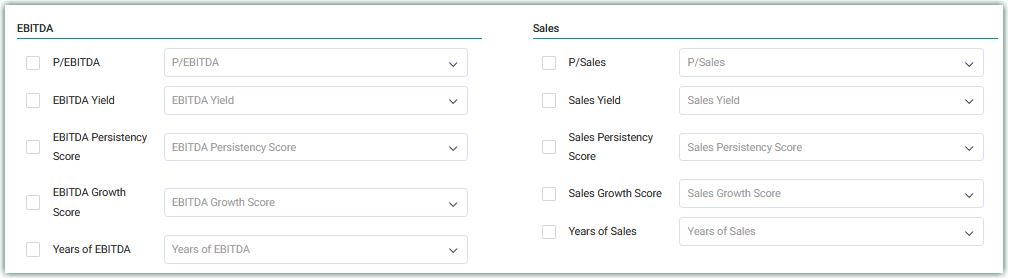
Persistency Score
Persistency Score is a % measure of how persistent a company's metric has been over its total length available on FAST Graphs. The score represents a percentage of the time including calculated monthly values that the earnings metric line is within the perfect persistency corridor. This corridor has a width of (1 plus the growth rate percentage) times (plus and minus) 10% times the persistent fit point for each fiscal year. The width of the corridor is mainly affected by the 10% width multiplier and the persistent fit point, but the higher growth rate of the earnings metric also provides a width boost for the corridor calculation. You can also think of the (plus and minus) 10% as being the allowable error rate or variation rate around the persistent fit point.
Growth Score represents the number of times the selected metric has grown over the total length represented as a %.
Number of Years represents the amount of data we have available for the company. You can use this field to find older companies or younger companies from the screening tool.
Persistency represents how consistent the growth of the company is. A certain point in time is scored one point as long as it’s within an identified range. A point in time that is above the range, is scored partial points in order to not fully penalize an outstandingly good result. And anything below the range is scored zero points. This is only available for the “Max” Historical timeframe, and we may create persistency scores for shorter timeframes in the future.
The definition of persistency score is a rating of how persistent the earnings of a company have grown. Cyclical companies will not be highly rated, and companies growing too fast and then slowing down will not be as persistent as a company that has grown at consistent rates.
Persistency Score Video
Valuation - Current / Forward
VALUATION - CURRENT / FORWARD is a proprietary metric (likely will not be shown in detail in the future) that for our use in valuation-based preset screens and shows the specific companies CURRENT VALUATION and FORWARD VALUATION. Basically the way we use it is to check to see if a company is currently in value according to the current estimates and also if the company is still in value based upon the current price at the end of our last specific estimate.
The following information provides an explanation of the valuation metrics used to assess the stock price’s relationship with the estimated future earnings per share (Adj. EPS). The two main metrics discussed are “Current Valuation” and “Forward Valuation.” These metrics are used to determine whether a stock is undervalued or overvalued based on the estimates chart for Adj. EPS.
- Current Valuation:
Current valuation is a calculation that measures how much the stock’s price deviates from the orange line on the estimates chart ONLY for Adj. EPS, at the present moment. The orange line represents the projected price based on the earnings estimates.
1.1. Calculation:
The current valuation is determined by finding the percentage difference between the current stock price and the value indicated by the orange line on the estimates chart.
1.2. Interpretation:
When the current valuation is negative, it signifies that the stock is undervalued. A negative value implies that the current stock price is below the projected value based on the Adj. EPS estimates.
Example:
Suppose the current valuation is calculated as -3%. In this scenario, the stock is considered to be 3% undervalued, indicating that its current market price is 3% below the projected value based on the Adj. EPS estimates.
- Forward Valuation:
Forward valuation is similar to current valuation but takes into account how much the stock could be worth at the furthest out estimate on the Adj. EPS estimates chart.
2.1. Calculation:
To calculate the forward valuation, we determine the percentage difference between the stock’s current price and the value indicated by the orange line corresponding to the furthest out estimate on the estimates chart.
2.2. Interpretation:
When the forward valuation is negative, it indicates undervaluation. This means that the stock’s current price is below the projected value based on the Adj. EPS estimate at the furthest date on the chart.
Example:
Suppose the forward valuation is calculated as -10%. In this case, the stock is considered to be 10% undervalued, suggesting that its current market price is 10% below the projected value based on the Adj. EPS estimate at the date of the furthest estimate on the chart.
- Summary:
In summary, the valuation metrics, “Current Valuation” and “Forward Valuation,” provide insights into whether a stock is undervalued or overvalued based on the estimates chart for Adj. EPS. Negative values indicate undervaluation, while positive values imply overvaluation. By analyzing these metrics, investors can make informed decisions regarding their investments.
Please note that these valuation metrics are solely based on the Adj. EPS estimates and do not account for other metrics yet. It is essential to consider other financial indicators and conduct thorough research before making investment decisions.
Updated about 2 months ago