
Performance Chart
The Performance Chart gives you a deeper look into stock performance over the selected timeframe and compares it to the SPDR S&P 500 ETF Trust (SPY) over that exact timeframe.
Click here to learn more about the Historical Graph.
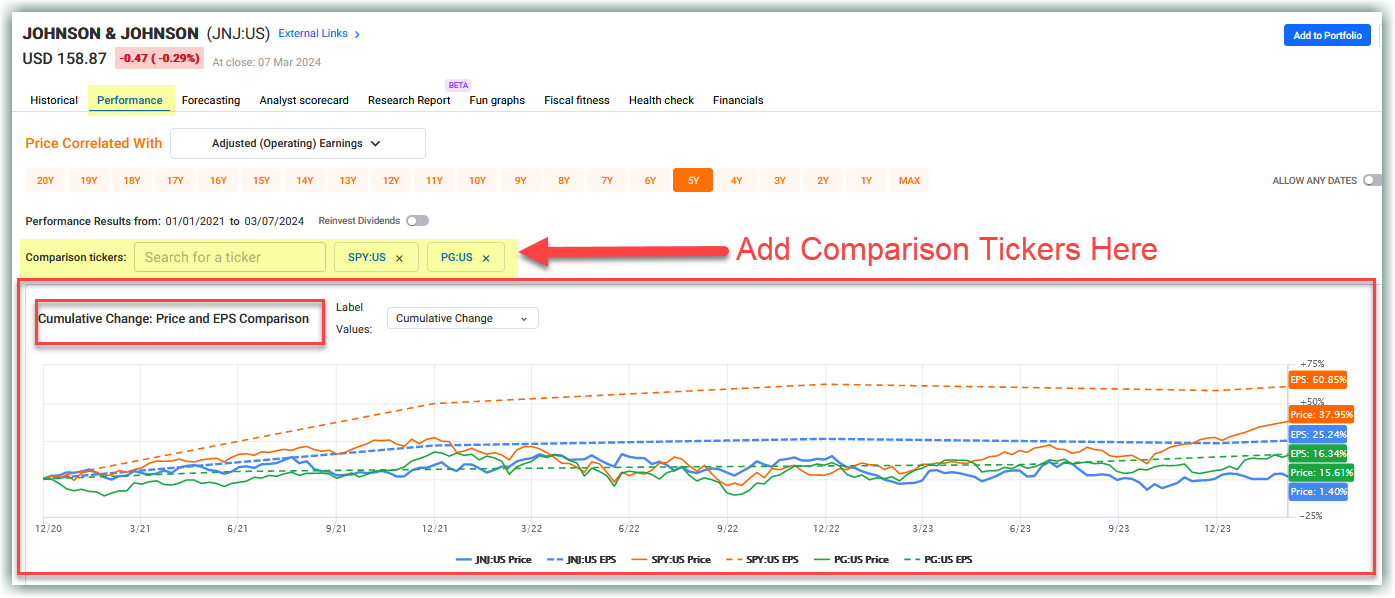
Cumulative Change: Price and EPS Comparison
This chart displays the cumulative change of the price and the selected metric for the primary ticker alongside up to three comparison tickers. It enables direct comparison of both stock price performance and fundamental company growth against other stocks.
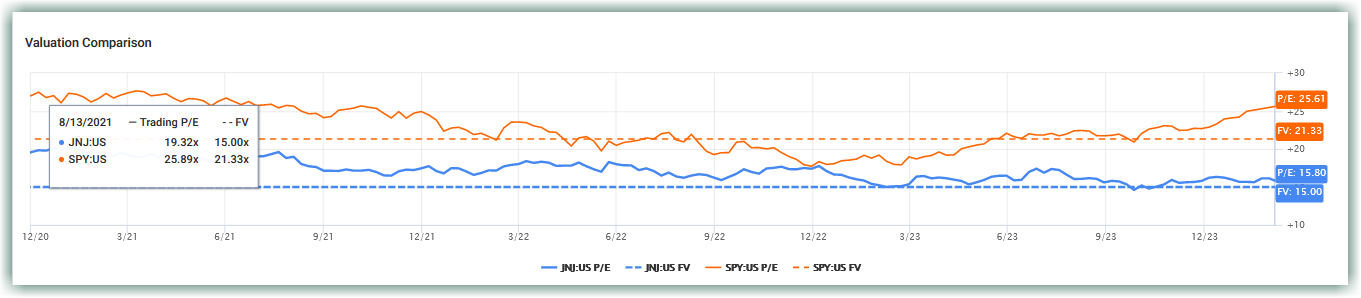
Valuation Comparison
Compare the PE ratio against the Fair Value (FV) ratio from the historical graph over your selected timeframe. This feature allows for a more nuanced analysis of stock performance with valuation metrics as a reference point.
There are three sections you will find on the Performance Chart:
- Stock Price Results
- Dividend Cash Flow
- Total Performance

Dividend Cash Flow
The Dividend Cash Flow section is made up of seven columns displaying different important information regarding dividends (if the stock has any). From left to right, these columns are:
- End of Fiscal Year Date
- Dividends Paid Per Share for that year
- Dividend Year-over-Year Growth
- Dividend Payout Ratio according to the selected metric
- End of Period number of shares
- The amount of dividends paid on the investment
- The Yield-on-Cost of the investment
This calculation is different from dividend yield. The yield on Cost represents the dividend yield on the actual cost of the investment and can grow substantially each year.
Any row with asterisks means these numbers are quarterly numbers and not fiscal numbers. This case will be apparent when the end date is the current fiscal year that hasn’t ended yet.
Total Performance
The Total Performance section provides all of the relevant final performance calculations for the selected timeframe. In this section you will find:
- Dividend Growth Rate: Average Growth and Compound Annual Growth (CAGR)
- Stock Performance vs SPDR S&P 500 ETF Trust (SPY) Performance over the same timeframe
Performance Chart Tutorials
Updated about 1 month ago